
Who Will Be the Winner of the Tariff War?
Updated: April 2025
Overview
This report analyzes mutual import vulnerabilities between the United States and China using 2024 trade data from the UN COMTRADE database. The analysis is grounded in the Supply Chain Dominance Index methodology developed by the IFS Economic Security Cluster, which evaluates structural trade dependencies by combining bilateral import reliance with global market concentration of the exporting country. Note that 2024 trade data are not complete due to reporting delays. For comparison, we also examine 2023 results.
Framework
Both graphs plot individual HS6 digit products by the following criteria:
- X-axis: Exporter's Global Market Share (USA's or China's, respectively)
- Y-axis: Importer's Dependence on the Exporter
- Bubble Size: Trade value in USD
- Color: Product sector classification (first digits of HS 6 code)
The red-shaded "High Vulnerability Zone" includes products where:
- Import Dependence > 0.4
- Exporter's Market Share > 0.1
- These products are economically and strategically significant, as they are both difficult to substitute (Exporter's Market Share > 0.1) and highly reliant on a single supplier country (Import Dependence > 0.4).
Vulnerability Analysis Charts (2024)
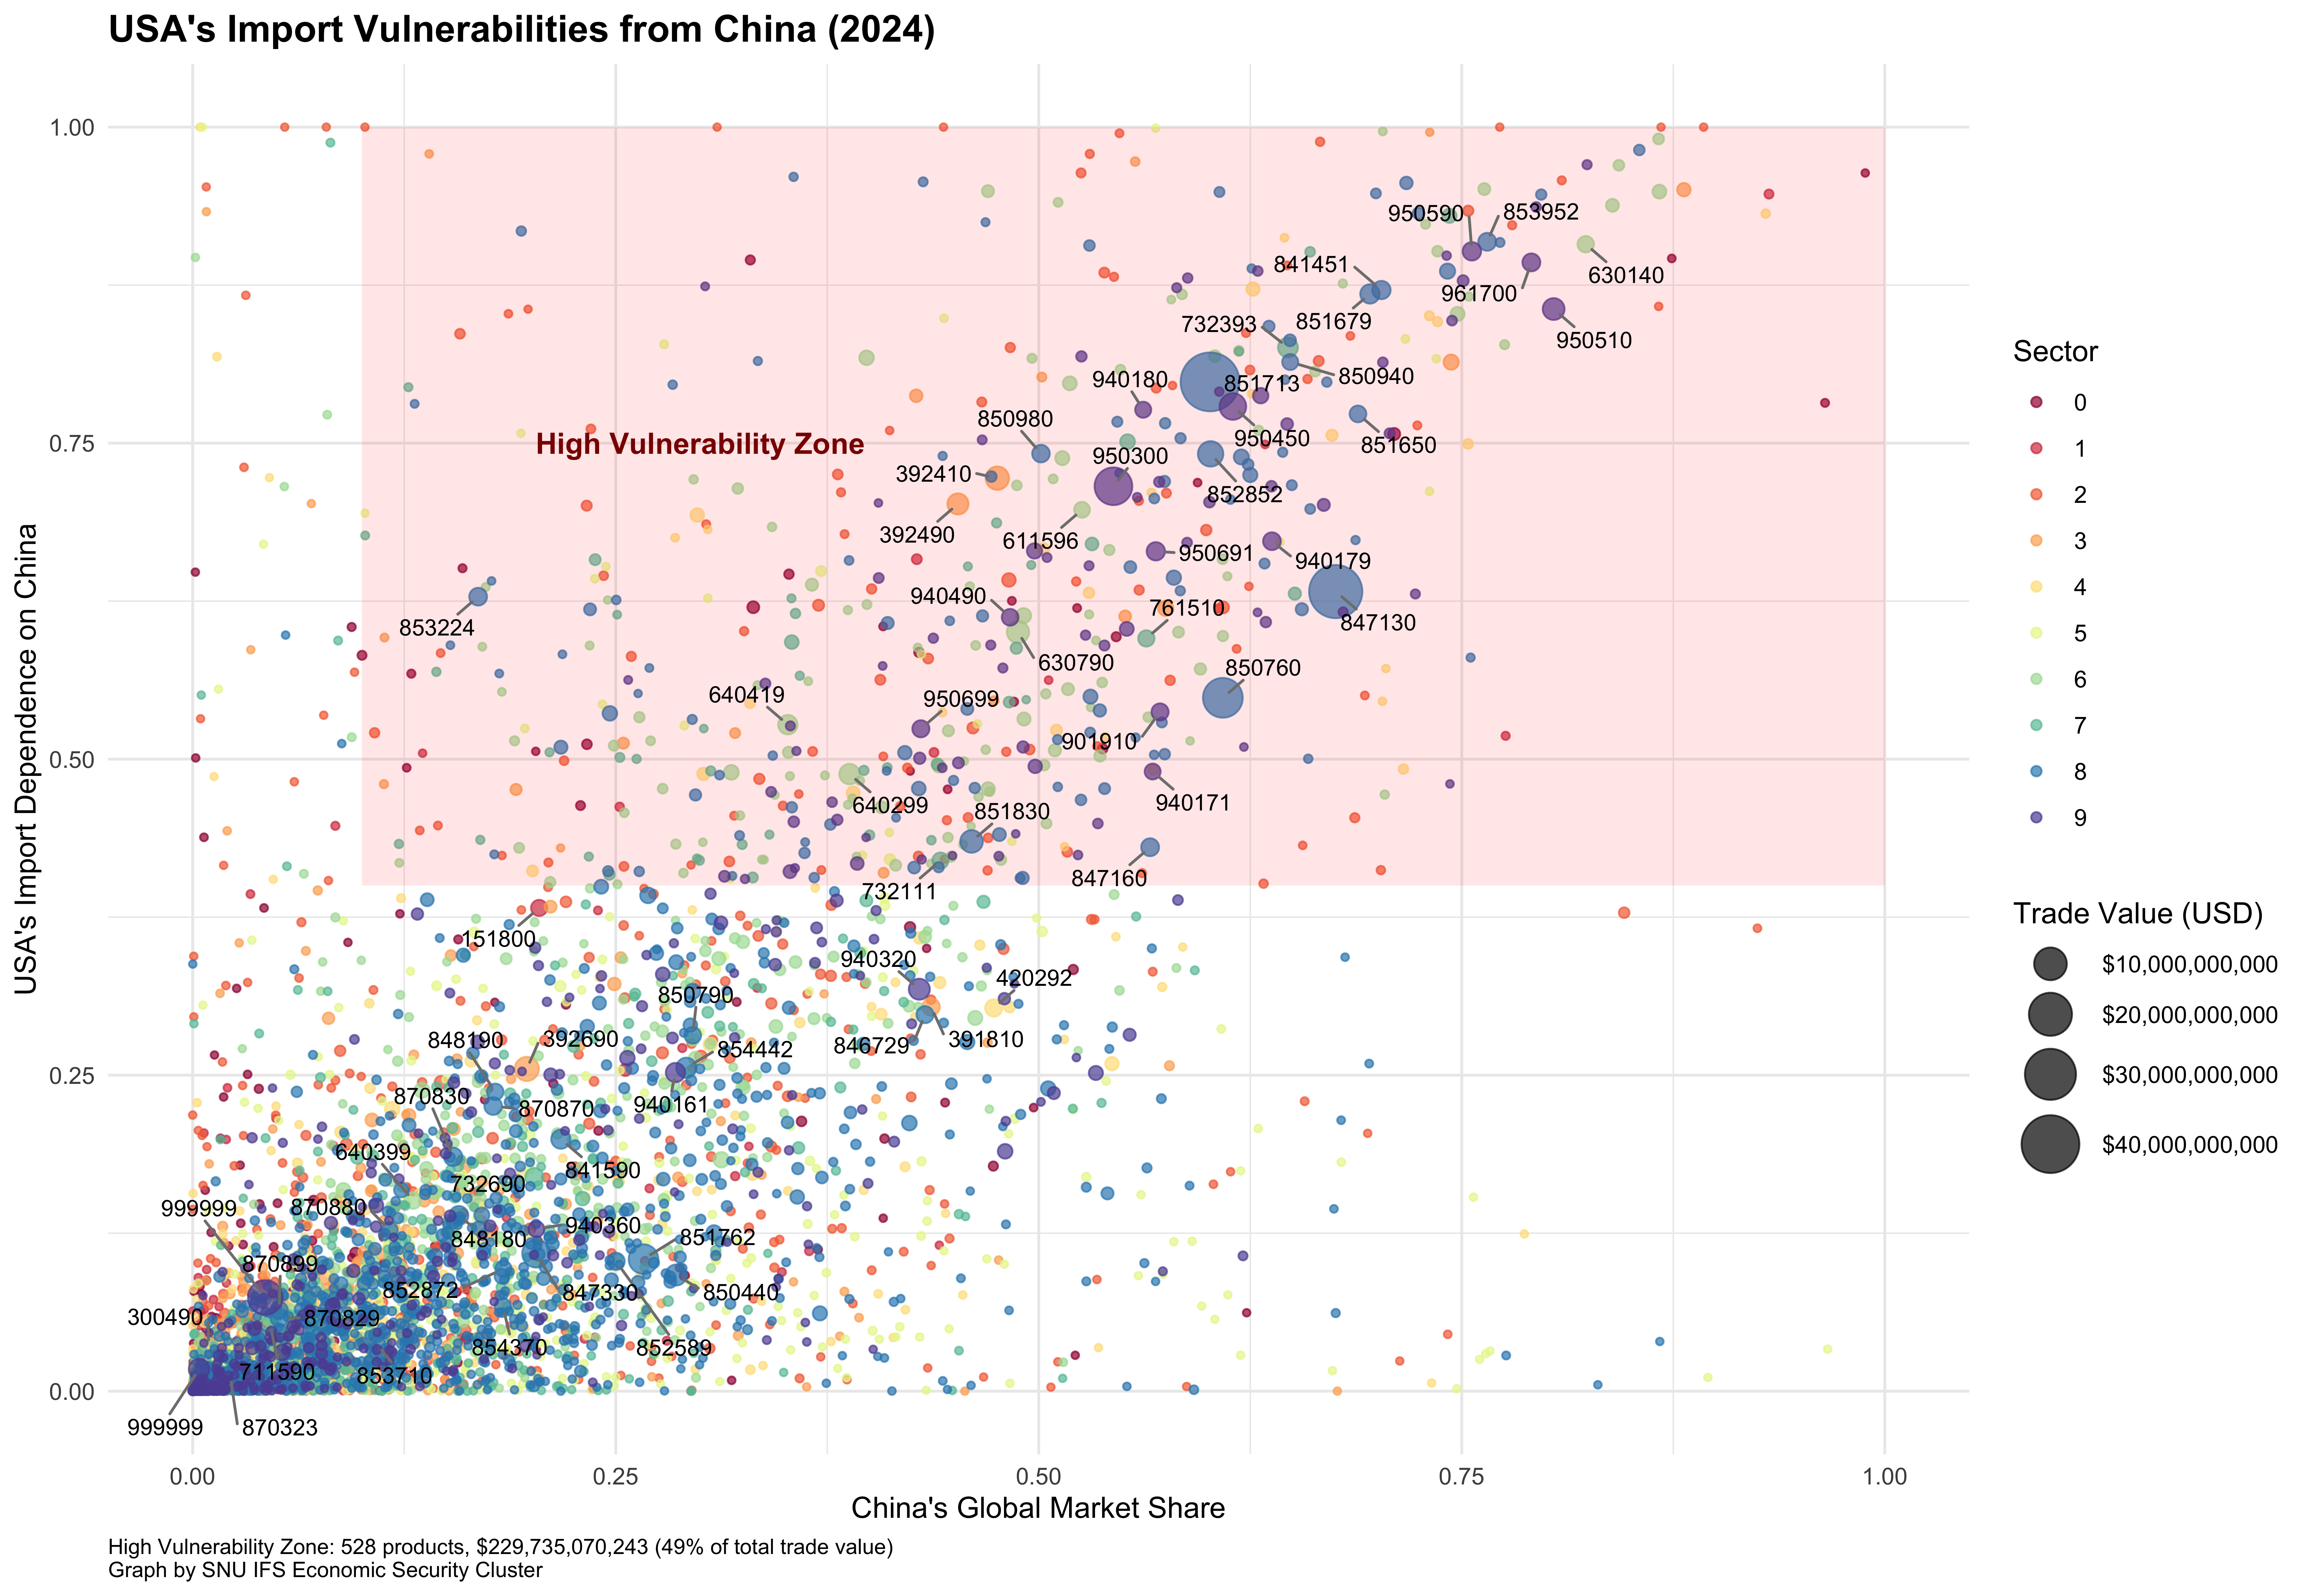
The charts above display the current (2024) vulnerability analysis between USA and China.
Key Observations
1. China's Import Vulnerabilities from the USA
- 322 products fall within the high vulnerability zone.
- These products represent a trade value of $23.2 billion, accounting for 14% of China's total imports from the U.S.
- Vulnerability is concentrated in niche, low-volume products with relatively low overall economic weight.
- China's exposure is more dispersed across sectors, suggesting better diversification and potentially greater resilience.
2. USA's Import Vulnerabilities from China
- 528 products fall in the high vulnerability zone.
- These account for a total trade value of $229.7 billion, representing a much higher 49% of U.S. imports from China.
- The vulnerable products include larger clusters of high-dependence, high-value imports.
- Many products are critical to U.S. supply chains, particularly in intermediate goods and consumer products.
Who Suffers More?
✅ China is better positioned to withstand a tariff war.
The evidence suggests a clear asymmetry in trade vulnerabilities:
- Asymmetric Vulnerability: The U.S. is significantly more dependent on China for key imports than China is on the U.S. Nearly half of U.S. imports from China fall in the high vulnerability zone, compared to only 14% for China.
- Import Substitution Challenges: The U.S. may face greater difficulty replacing imports in many sectors where China dominates global market share.
- Economic Impact: A trade war would likely cause more immediate disruption to U.S. supply chains and increased consumer prices, due to the higher absolute value and concentration of vulnerable products.
- Negotiating Leverage: China's lower vulnerability provides stronger leverage in trade negotiations, potentially allowing it to absorb pressure more effectively.
Conclusion
Holding other factors constant—such as broader macroeconomic resilience, third-country substitution options, long-term industrial policies, exchange rate movements, and political willingness to absorb short-term pain—the United States is likely to suffer more economically in a prolonged tariff war with China.
The data suggest that China's import structure is more resilient, while the U.S. is exposed to greater strategic and economic risks due to its dependence on Chinese exports, particularly in high-value, hard-to-replace products.
Appendix: Historical Comparison (2023)
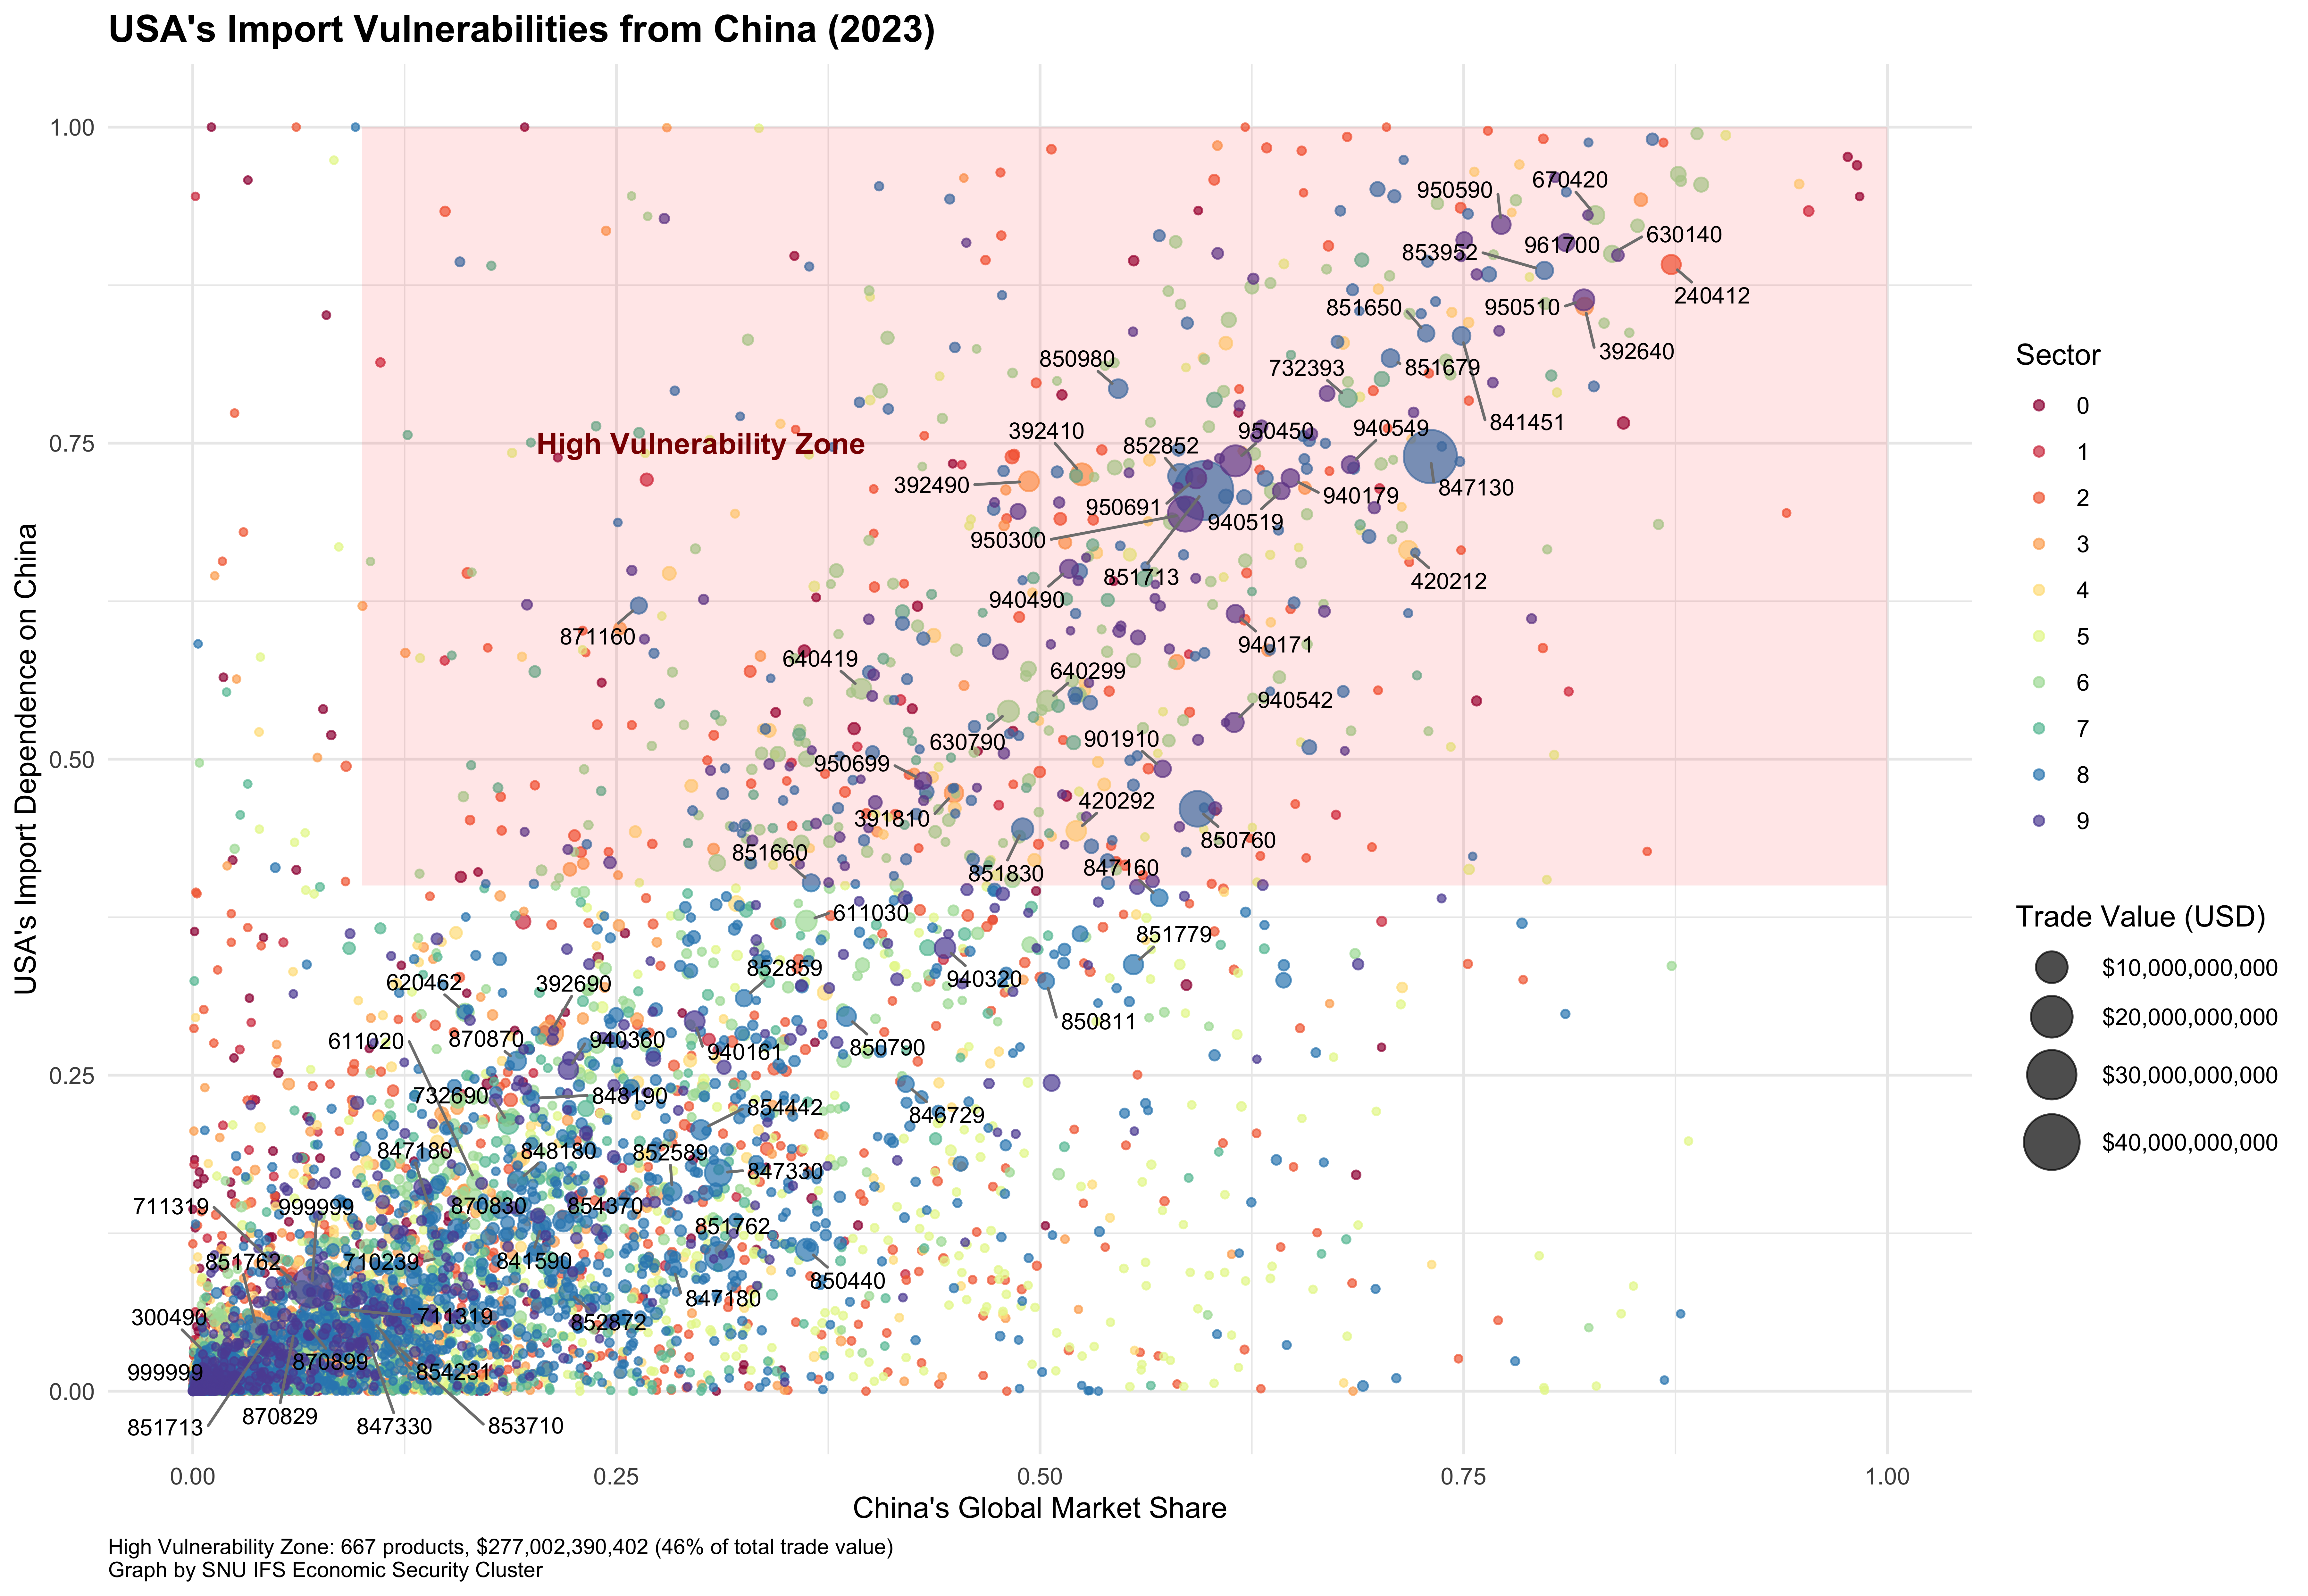
The charts above show the historical (2023) vulnerability analysis for comparison purposes.